Q: Why does my audiogram look like a dipping line, and what does that dip actually mean? A: That’s one of the most common questions people ask after leaving their hearing test with a piece of paper full of X’s, O’s, and a graph they were never quite walked through carefully enough to understand.
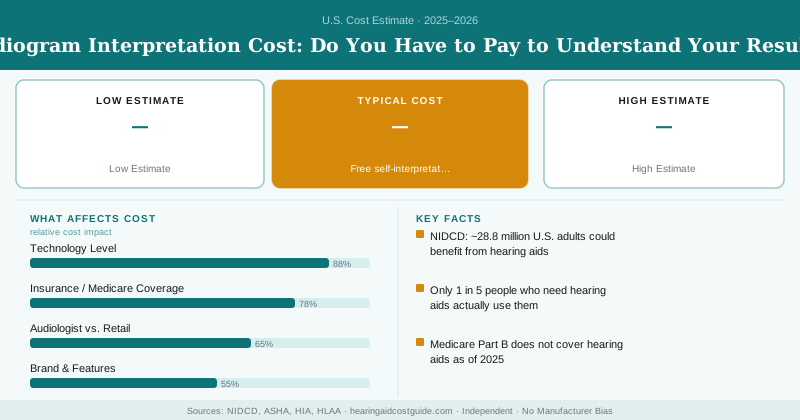
The good news: interpreting your own audiogram, at least at a basic level, doesn’t cost anything extra beyond your original hearing test fee — and it’s a skill you can build with a little guidance.
What Audiogram-Related Services Cost
| Service | Cost | What You Get |
|---|---|---|
| Standard audiogram + interpretation (bundled) | $150–$350 | Full test plus audiologist walkthrough, same visit |
| Standalone second-opinion review | $50–$150 | Professional review of existing results, no new test |
| Copy of your audiogram (records request) | $0–$25 | Administrative fee, varies by practice |
| Independent tele-audiology consult | $75–$200 | Remote review via video call with a licensed audiologist |
| Free self-interpretation resources | $0 | ASHA, NIDCD, and hearing aid manufacturer guides |
How to Read the Basic Shape of Your Audiogram
An audiogram plots frequency (pitch, measured in Hz) along the horizontal axis, from low pitches on the left to high pitches on the right, and hearing level (loudness needed for you to detect a sound, measured in decibels) along the vertical axis, with softer sounds at the top and louder sounds needed at the bottom. Your results are marked with symbols — typically an “X” or blue line for your left ear, and an “O” or red line for your right ear.
The further down the chart your marks fall, the louder a sound needs to be for you to hear it — meaning more hearing loss. A relatively flat line near the top indicates normal hearing across frequencies. A line that drops toward the bottom-right indicates the most common pattern: high-frequency hearing loss, typically associated with aging or noise exposure.
Severity Classifications You’ll See
- Normal: 0–25 dB HL
- Mild loss: 26–40 dB HL
- Moderate loss: 41–55 dB HL
- Moderately severe loss: 56–70 dB HL
- Severe loss: 71–90 dB HL
- Profound loss: 91+ dB HL
These classifications, used consistently across the audiology field per ASHA standards, are what your audiologist references when explaining “you have moderate hearing loss in the high frequencies” — the number ranges are standardized, not practice-specific.
A 45 dB loss at 500 Hz (a lower pitch, important for vowel sounds) affects your hearing differently than a 45 dB loss at 4000 Hz (a higher pitch, important for consonants like “s,” “f,” and “th”). This is why two people with the same “average” hearing loss number can have very different real-world experiences — one may struggle mainly with women’s and children’s higher-pitched voices, while the other has more general difficulty across all speech.
Why Interpretation Is Bundled, Not Separately Billed
Audiologists build interpretation time directly into the evaluation appointment because the test and its explanation are considered one clinical service — CPT billing codes for audiometric testing include the professional interpretation as part of the same code, not a separate line item. This is standard practice across nearly all audiology settings, from hospital systems to retail hearing centers, so you shouldn’t expect or accept a separate bill just for having your results explained.
When a Second Opinion Is Worth the Extra Cost
- Results seem inconsistent with your actual day-to-day hearing experience
- A significant treatment recommendation (like implant surgery) is based on the results and you want independent confirmation
- Asymmetric results between your two ears that weren’t fully explained
- You’re comparing quotes from multiple hearing aid providers and want an independent read on severity before committing to any specific device recommendation
Free Resources for Self-Education
Both ASHA (asha.org) and the NIDCD (nidcd.nih.gov) publish free, plain-language guides to reading audiograms, including sample charts and explanations of common patterns like presbycusis, noise notches, and conductive loss profiles. These won’t replace your audiologist’s personalized explanation, but they’re a legitimate, no-cost way to build baseline literacy before or after your appointment.
Don’t rely solely on a printed audiogram handed to you without a verbal walkthrough. Ask your audiologist directly to explain what your specific pattern means for your daily hearing experience — a flat piece of paper with symbols on it is far less useful than understanding, in plain language, why you struggle in restaurants but not on the phone, for example.
If you leave an appointment still unsure what your results mean, call back and ask for a follow-up explanation — this is a standard part of the service you already paid for, not an extra request.
Frequently Asked Questions
No, in almost all cases. Audiogram interpretation is included as part of the standard $150–$350 hearing evaluation fee — your audiologist explains the results as part of that same appointment, at no separate charge.
A standalone second-opinion review of an existing audiogram, without a new full hearing test, typically costs $50–$150 at most audiology practices, since it requires less time than a full evaluation but still involves professional clinical review.
Yes, to a meaningful degree. Audiograms follow a standardized format (frequency on the X-axis, decibel loss on the Y-axis, with symbols for each ear), and free resources from ASHA and NIDCD explain how to interpret the basic pattern and severity classification yourself.